This site uses cookies to improve your experience. To help us insure we adhere to various privacy regulations, please select your country/region of residence. If you do not select a country, we will assume you are from the United States. Select your Cookie Settings or view our Privacy Policy and Terms of Use.
Cookie Settings
Cookies and similar technologies are used on this website for proper function of the website, for tracking performance analytics and for marketing purposes. We and some of our third-party providers may use cookie data for various purposes. Please review the cookie settings below and choose your preference.
Used for the proper function of the website
Used for monitoring website traffic and interactions
Cookie Settings
Cookies and similar technologies are used on this website for proper function of the website, for tracking performance analytics and for marketing purposes. We and some of our third-party providers may use cookie data for various purposes. Please review the cookie settings below and choose your preference.
Strictly Necessary: Used for the proper function of the website
Performance/Analytics: Used for monitoring website traffic and interactions
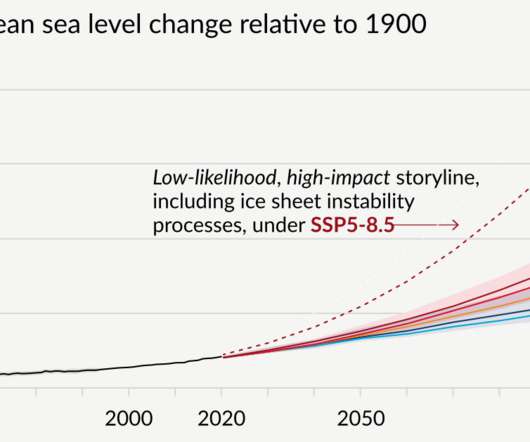
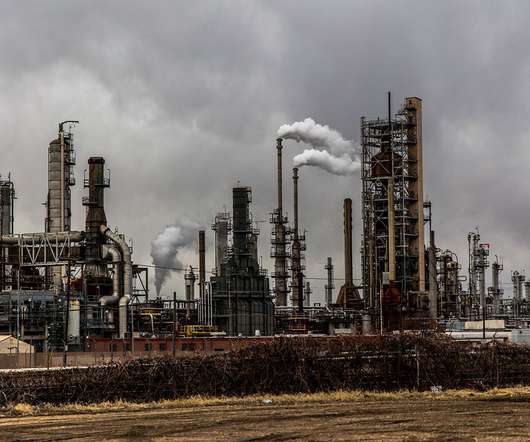
My top 3 impressions up-front: The sealevel projections for the year 2100 have been adjusted upwards again. The IPCC gives more consideration to the large long-term sea-level rise beyond the year 2100. And here is the key sea-level graphic from the Summary for Policy Makers: Source: IPCC AR6, Figure SPM.8.
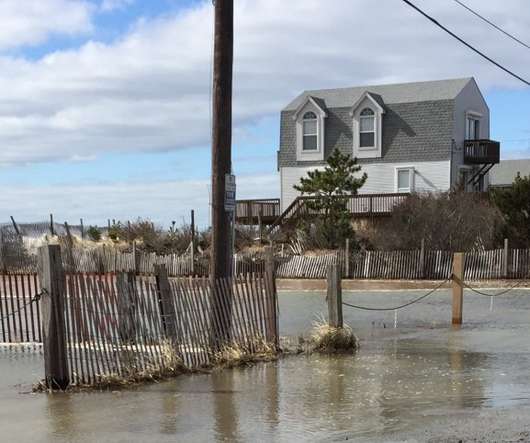
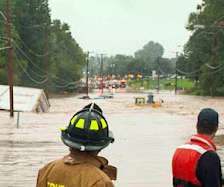
Summer tourism, sealevel rise, and storm surges threaten East Coast wells. Storm surge overwash in Charlestown barrier-strip island due to nor’easter storm in March 2018. Hilton Head is fast becoming a prominent test case of rising sealevels and intense coastal storms heralded by climate change.
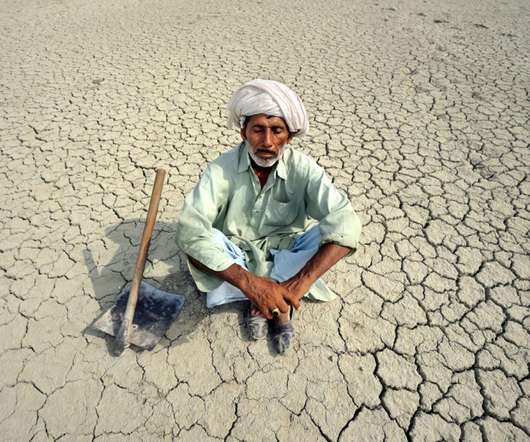
By comparing these two data sets, scientists can determine the probability that human activities are responsible for observed changes in temperature, precipitation patterns, sealevel rise, and other climate change indicators. A study of a 2018 South African drought found that climate change made it three times more likely.
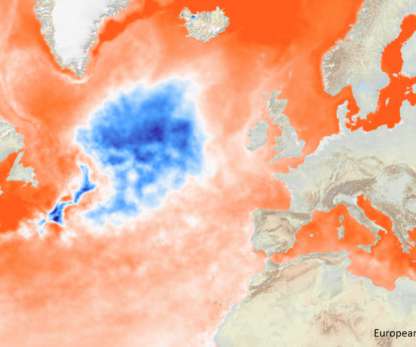
Sea surface temperature trend 1993 – 2018, from European Atlas of the Seas. 2018) Observed fingerprint of a weakening Atlantic Ocean overturning circulation, Nature 556: 191-196. 2022), Greenland ice sheet climate disequilibrium and committed sea-level rise, Nature Clim. 44: 1919-1927. Rahmstorf, S.,
There was a workshop in 2018 (that I attended) to discuss how one might go about doing something better – updating the data, improving quality control, and using models to better connect local or regional signals to the global means. and, like many of us, had found the then-current literature somewhat unsatisfactory. van der Meer, C.R.
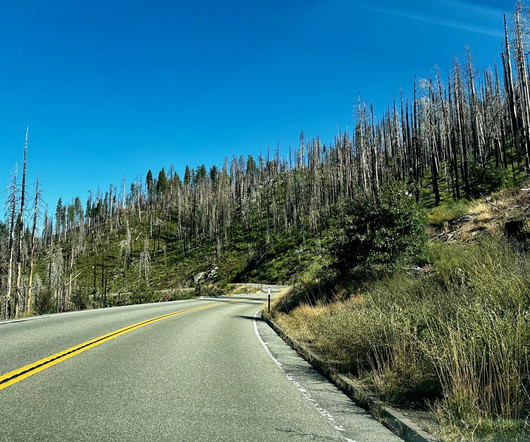
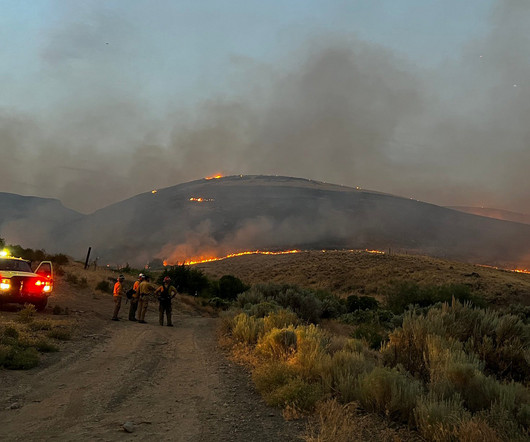
From droughts to wildfires to rising sealevels and torrential rains, the state has felt the effects of a changing climate in a variety of ways. California has experienced a significant increase in the extent of forest fires in recent decades, with a fivefold increase in annual burned area from 1972 to 2018.
The global mean sealevel has increased by 20 cm from 1901 to 2018, and the rate of increase has accelerated and is now about 3.7 A thermal expansion explained 50% of sealevel rise during 1971–2018, while ice loss from glaciers contributed 22%, ice sheets 20% and changes in land water storage 8%.
California Governor Jerry Brown in Bonn for the 2018 climate summit. They are often left to deal with climate effects on the ground, from wildfires to sealevel rise to drought, and they can provide a political bulwark of sorts even as U.S. Photo credit Alexandra Gay, member of the UCLA Law delegation that year.
Add climate change and we need to keep track of which decade these flood levels were determined. For example, with expected sealevel rise over the next few decades what currently would be extreme coastal floods (50-year floods or a large flood with only a 2% chance in any given year) are likely to occur annually for most coastal U.S.
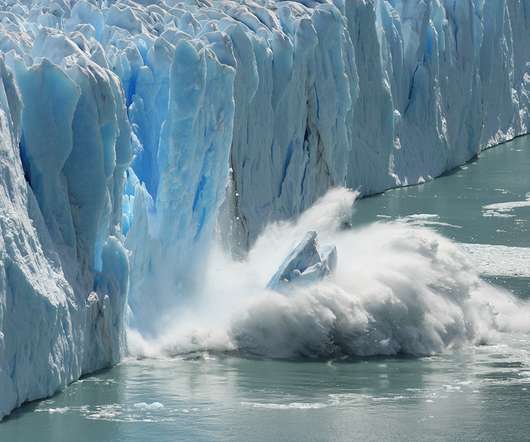
Total loss of the Greenland ice sheet, for example, would raise sealevels globally by more than 20 feet. The paper sets out an agenda for research into ways to limit glacial ice-sheet deterioration and associated sealevel rise. Open Arctic sea lanes dramatically shorten shipping times from China to Europe.
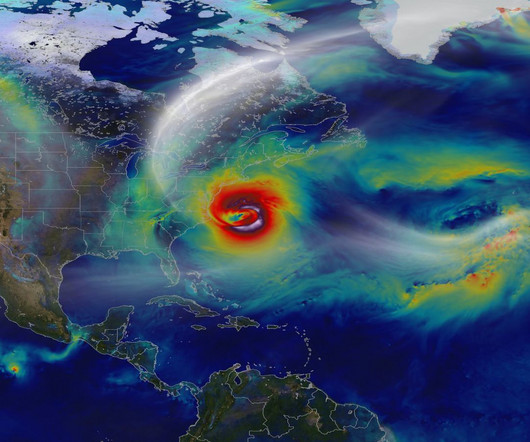
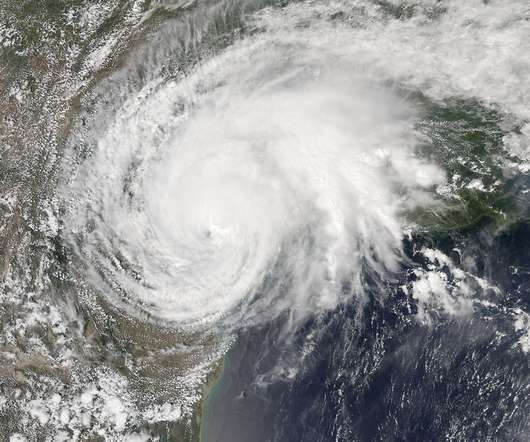
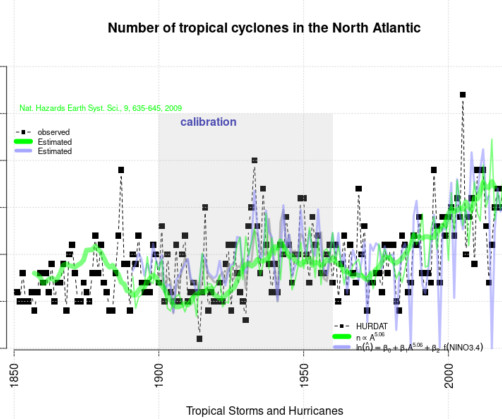
We have discussed the statistics on tropical cyclones in previous posts here on RealClimate: ‘ Climate Change and Tropical Cyclones (Yet Again) ’ (2008) and ‘ Does global warming make tropical cyclones stronger? ’ (2018). Support for the warm-area-connection? References R.E. 635-645, 2009. Blunden, T.
Since 2018 we have worked together with Chevron to be a ‘Force for Good’ in our region by providing resources and opportunities for youth soccer players,” LAFC Co-President & CBO Larry Freedman said in a press release. “I
So the Ditlevsens used sea surface temperatures (SST) in a region between the tip of Greenland and Britain as an indicator, based on Caesar et al. 2018 ( PDF ; I’m a coauthor on that paper). We have direct AMOC measurements only since 2004, a time span too short for this type of study. The reanalysis data show the latter is the case.
Massachusetts pointed to the loss of coastal land from sea-level rise, while the Urgenda judgments ultimately concluded that there is a serious risk that climate change will cause the human rights of people in the Netherlands to not be met. To determine what this requires, the court turns to the 2018 Special Report on 1.5°C
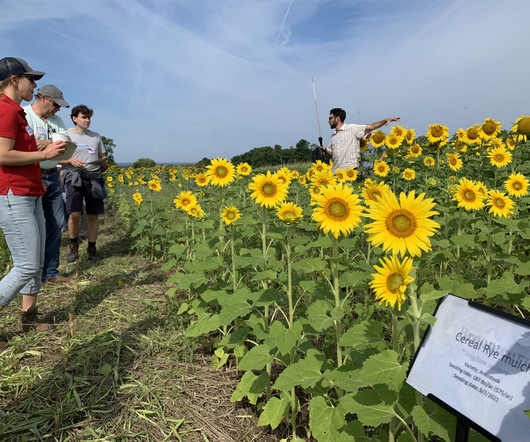
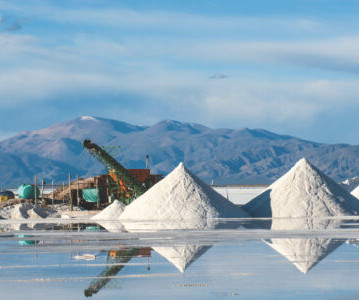
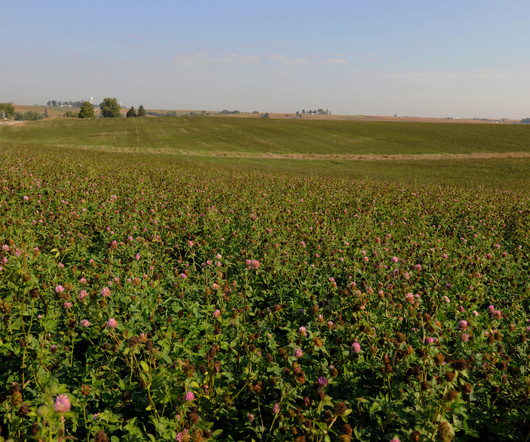
Policy and socioeconomic constraints on the growth of the organic sector (adopted in 2018 as a specific program priority). Similarly, Clemson University received funding to develop salt-tolerant rice cultivars for organic farms affected by rising sealevels. Organic utilization and production of perennial planting stock.
In 2013, Jianli Chen and colleagues at the University of Texas, Austin showed that an eastward drift of the poles that began in 2005 is linked to melting glaciers and the associated sea-level rise. This allowed GRACE to determine the shape of the Earth and monitor changes in sealevel, glaciers and groundwater.
As reported in the Intergovernmental Panel on Climate Change’s (IPCC) Special Report on the Ocean and Cryosphere in a Changing Climate , “[t]he ocean is essential for all aspects of human well-being and livelihood” and ocean warming, acidification and sealevel rise are impacting fisheries and food production and depleting key ecosystem services.
The report, The Thin Green Line, looks at staffing levels and funding for environmental programs between 2008 and 2018 in the lower 48 states. environmental programs experienced one of the highest levels of cuts to both operating budgets and staff in the country. 2018 Funding. $116 2008 Funding. 116 million. $136
Global warming is leading to sea-level rise on an unprecedented scale, according to IPCC scientists. Between 2006 and 2016 sealevels globally rose 2.5 At the same time, the seas are warmer than they used to be, which can lead to more tropical storms and a higher risk of coastal flooding. metres by 2100. (In
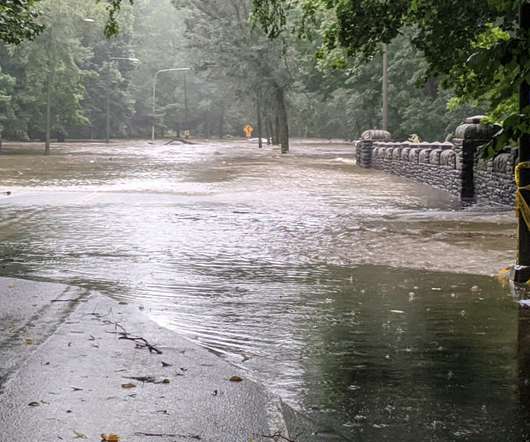
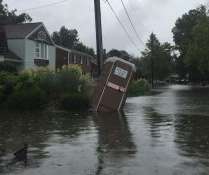
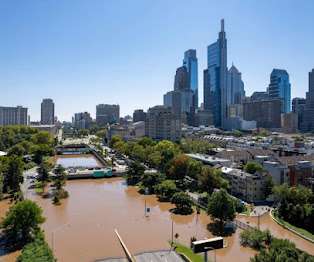
As extreme storms become more ubiquitous, Philadelphia is among numerous cities grappling with flooding issues against the backdrop of aging infrastructure, rising sealevels and more extreme precipitation events. chance of happening in any given year, respectively. Flooding on the Schuylkill River from Hurricane Irene, 2011.
In 2018, CDI commissioned a first-of-its kind climate risk scenario analysis of California insurers, analyzing the investment portfolios of insurance companies operating in California and earning over $100 million annually in national premiums.
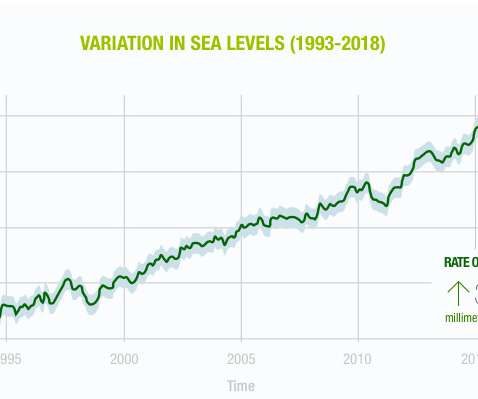
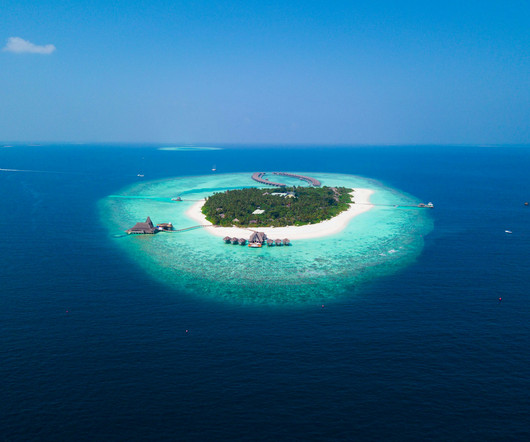
Rising sealevels and increased intensity of storm surges are playing a considerable role in the degradation of coastal regions in the Pacific Islands. Illustrating the variation in sealevels from 1993 – 2018. Source: NASA (August 2018). Photo credit. Written by: Jack McCulloch. should be. [4]
As those paying attention to agriculture know, climate impacts have become increasingly apparent since the last assessment was published in 2018. Sealevel rise is also important in the region, causing saltwater intrusion and salinization. Other risks include increasing tropical cyclones and sealevel rise.
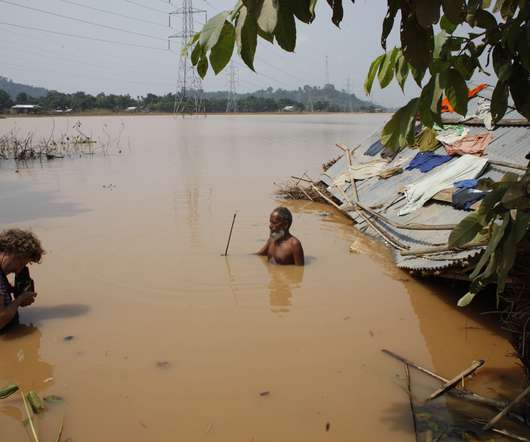
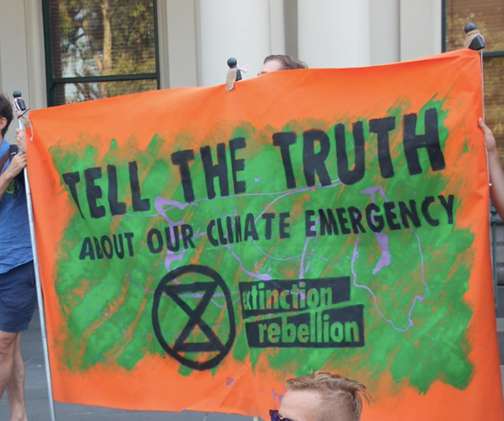
and India (2014), Brazil and Bangladesh (2015) and France (2016 and 2018). It was curated by Caitlín Doherty for the Museum of Contemporary Art Jacksonville, a cultural institute of the University of North Florida, in 2018. He photographed flooding in the U.S. Gideon Mendel: Drowning World is on view through Sunday, Oct.
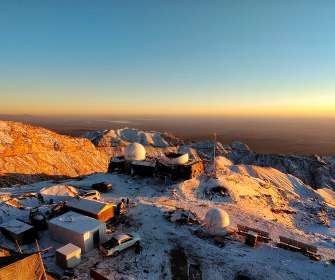
Since March 2018, a team led by Licai Deng from the National Astronomical Observatories of China, Chinese Academy of Sciences, has been monitoring cloudiness, night-sky brightness, air temperature, humidity, wind speed and direction at “Summit C” on Saishiteng Mountain, which lies some 4200 m above sealevel. Michael Ashley.
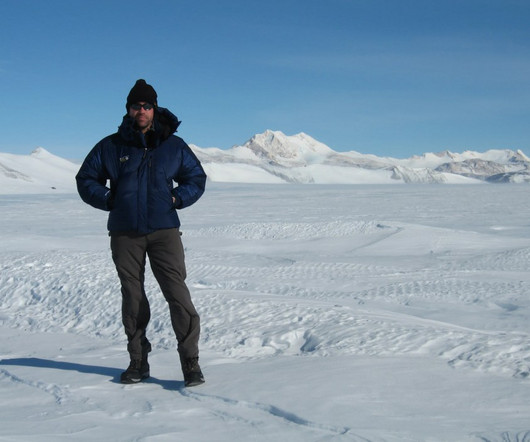
In addition, it stores vast quantities of freshwater that if released to the ocean would rise sealevel by tens of meters and interfere with saline-driven ocean currents that transfer heat around the planet. In the ocean, 19 marine heatwaves have been recorded between 2002 and 2018. Prof Martin Siegert in Antarctica.
The 2018 Disaster Recovery Reform Act authorized FEMA to invest six percent of its disaster costs in resilience (a 6% set-aside from post-disaster grant funds). FEMA’s Building Resilient Infrastructure and Communities (BRIC) program can provide funds for disaster mitigation. had disaster declarations.
by 2026-27 from a 2018-19 baseline. Nagpur to cut emissions by 20% Nagpur started in 2018 with the heat action plan that was first developed in Ahmedabad and has since been adopted by many cities in South Asia. Thane is in a high-rainfall zone and also faces the impacts of sealevel rise. million tonnes of CO2.
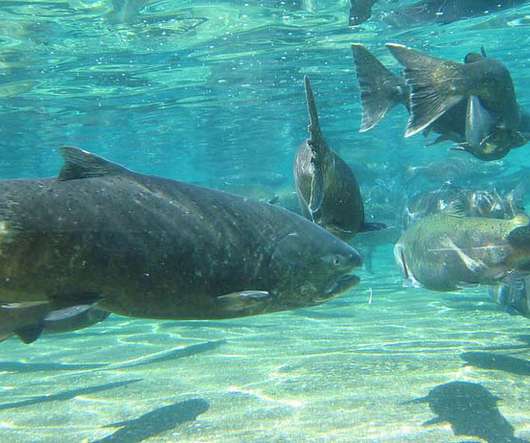
It was first rebuilt in 2013, was declared overfished again in 2018, and has been rebuilt again in 2021. It’s changing more than ever with rising sealevels, warming temperatures, ocean acidification, deoxygenation and more. What does this mean? The ocean is not at a stasis.
Some argue that environmental degradation is best understood as a threat to human security (Barnett and Adger 2007), and others focus on the inextricable ties between human well-being and the health of ecological systems to which we belong (McDonald 2018). Critical Studies on Security , 8(3), 189-202. Chicago McDonald, M.,
In 2018, a host of lawsuits wound their way through the courts seeking an answer, including several from localities and states alleging the responsibility of fossil fuel companies. Turning the Tide in Coastal and Riverine Energy Infrastructure Adaptation: Can an Emerging Wave of Litigation Advance Preparation for Climate Change?”
The sale follows the 2012 purchase and 2018 transfer of 16 acres of riparian land at the end of Pier 70 Boulevard by Natural Lands to DRWC. The pier and water area also afford us the opportunity to innovate and create a buffer for coastal resiliency as we plan for rising sealevels and future storms.
As recently as November, 21, 2018, the U.S. in October 2018. In July 2018, for example, Rhode Island filed suit against 21 fossil fuel companies, arguing that those companies should be held responsible for climate change impacts the state has experienced and will continue to experience. Martin Act.
billion annually, the equivalent of an increase between 78 percent and 480 percent, by the end of the century. -- Over 12,195 individual Federal buildings and structures could be inundated under ten feet of sealevel rise, with a total combined replacement cost of over $43.7 billion and $9.60
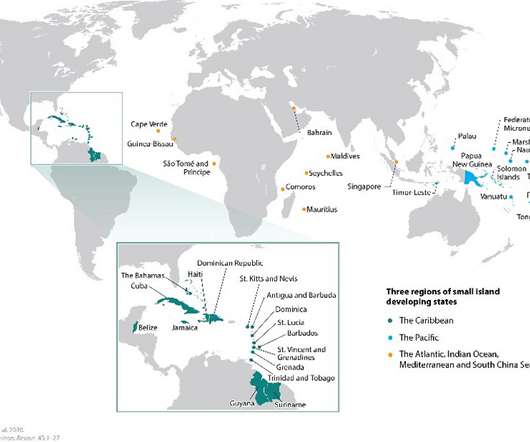
SIDS face a range of risks, including extreme floods, storms, droughts, unpredictability of precipitation patterns and sea-level rise, ocean acidification and deoxygenation (World Health Organization, 2018; Douglas & Cooper, 2020, Thomas, 2020). Baptiste, A., Martyr-Koller, R., Pringle, P., & Rhiney, K. Akiwumi, P.
As Pennsylvania’s climate has become warmer and there have been more swings in extreme weather, we’re already seeing more frequent flood damage to communities, businesses, homes, and crops and livestock, as well as coastal sealevel rise.
Each bill addresses emissions over roughly the same period—2000 to 2018 in Maryland, Massachusetts, and New York, and 2000 to 2019 in Vermont. Each bill also limits its reach to Super-emitters with “sufficient connection with the State to satisfy the nexus requirements of the U.S.
ITLOS refers to the Intergovernmental Panel on Climate Change’s 2018 1.5 C implies reaching net zero CO2 emissions globally around 2050 and concurrent deep reductions in emissions of non-CO2 forcers, particularly methane (high confidence)” (2018 Report, p. o C Warming Report which stated that “[l]imiting warming to 1.5°C
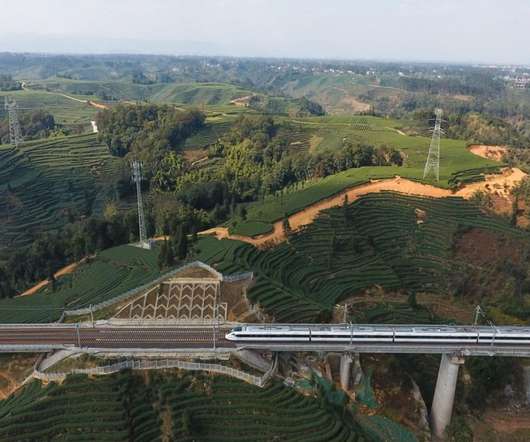
The design of the port was strengthened to account for higher sealevels and stronger storms, and an emergency response plan was drafted. “I This first segment of the railway opened in 2018. The government of South Africa carried out a climate risk assessment when planning to expand the Durban harbour. Photo credit: Alamy.
On December 28, 2018, California adopted comprehensive amendments to the California Environmental Quality Act (CEQA) Guidelines , which include a suite of provisions aimed at improving the analysis of greenhouse gas (GHG) emissions and climate change impacts in state environmental reviews. By Jessica Wentz.
In 2018, San Francisco voters approved a $425 million bond to protect the Embarcadero seawall from earthquakes and sea-level rise, which already contributes to regular flooding of the Embarcadero during extra-high tides.
Many of these are related to climate change, for example, flood zones, sea-level rise, and storm surge based on hurricane categories. Number of days until power was restored after Hurricane María by Census Tract (between February and August 2018). Map provided by Dr Marcel Castro-Sitiriche.
In just five years, from 2018 through 2022, wildfires scorched 38.3 Phillips, who has a doctorate degree in ecology from the University of Georgia, was a Kendall fellow at UCS from 2018 to 2020 and then a researcher at the University of Victoria in British Columbia. million acres across the country.
We are already seeing the depletion of the ice caps and rising sealevels. It became effective in 1975 and in 2018 has over 180 signatories. Dilution of salts in our oceans can affect the ecological balance of that ocean.
We organize all of the trending information in your field so you don't have to. Join 12,000+ users and stay up to date on the latest articles your peers are reading.
You know about us, now we want to get to know you!
Let's personalize your content
Let's get even more personalized
We recognize your account from another site in our network, please click 'Send Email' below to continue with verifying your account and setting a password.


Let's personalize your content