This site uses cookies to improve your experience. To help us insure we adhere to various privacy regulations, please select your country/region of residence. If you do not select a country, we will assume you are from the United States. Select your Cookie Settings or view our Privacy Policy and Terms of Use.
Cookie Settings
Cookies and similar technologies are used on this website for proper function of the website, for tracking performance analytics and for marketing purposes. We and some of our third-party providers may use cookie data for various purposes. Please review the cookie settings below and choose your preference.
Used for the proper function of the website
Used for monitoring website traffic and interactions
Cookie Settings
Cookies and similar technologies are used on this website for proper function of the website, for tracking performance analytics and for marketing purposes. We and some of our third-party providers may use cookie data for various purposes. Please review the cookie settings below and choose your preference.
Strictly Necessary: Used for the proper function of the website
Performance/Analytics: Used for monitoring website traffic and interactions
The year 2023 was by far the warmest in Earths recorded history, and perhaps in the past 100,000 years , shattering the previous record set in 2016 by 0.27C (0.49F). In that year, El Nio added to the increased warming caused by the build-up of heat-trapping emissions in the atmosphere, leading to that record-breaking heat.
Research with climate models in recent years shows that when carbon dioxide emissions stop, the rise in atmospheric temperatures will likely also stop. This means that there would be no additional warming of the atmosphere from carbon dioxide itself, but the many complex systems on Earth will continue to respond to the heat already trapped.
since the 1850-1900 baseline is very clearly associated with the increases in greenhouse gases, slightly (and decreasingly) modulated by the changes in atmospheric pollution. Dessler, "Evolution of the Climate Forcing During the Two Years After the Hunga TongaHunga Ha'apai Eruption", Journal of Geophysical Research: Atmospheres , vol.
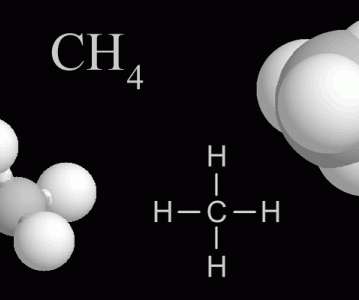
The radiative forcing from these changes in concentrations can be easily calculated using standard formulas (from Etminan et al, 2016 which supersede the slightly simpler ones from IPCC TAR), as about 2 W/m 2 for the CO 2 change and 0.65 W/m 2 for CH 4. In contrast, methane has a perturbation time-scale of about 12 years. Highwood, and K.P.
Signatures of ionized calcium in the upper atmosphere of an ultra-hot, Jupiter-like exoplanet have been found by international team of astronomers led by Emily Deibert at the University of Toronto. First discovered in 2016, WASP-76b has about the same mass as Jupiter and has a radius almost twice as large.
When looking at the effect of changes in greenhouse gases, one must look at how their forcing corresponds to the energy balance at the top of the atmosphere. 679-688, 2016. Another weak point is Kininmonth’s assumption of the water vapour being constant and at same concentrations as in the tropics over the whole globe. References.
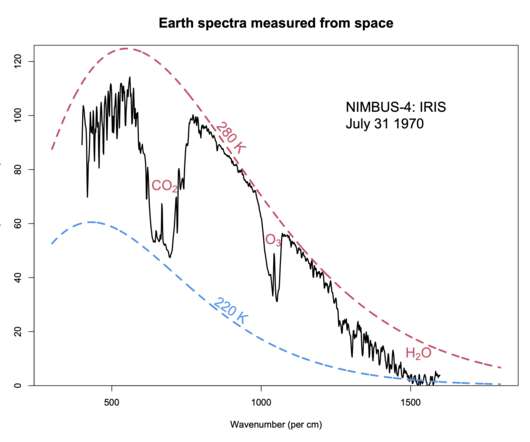
The fact that there is a natural greenhouse effect (that the atmosphere restricts the passage of infra-red (IR) radiation from the Earth’s surface to space) is easily deducible from; i) the mean temperature of the surface (around 15ºC) and, ii) knowing that the planet is normally close to radiative equilibrium. in IPCC TAR).
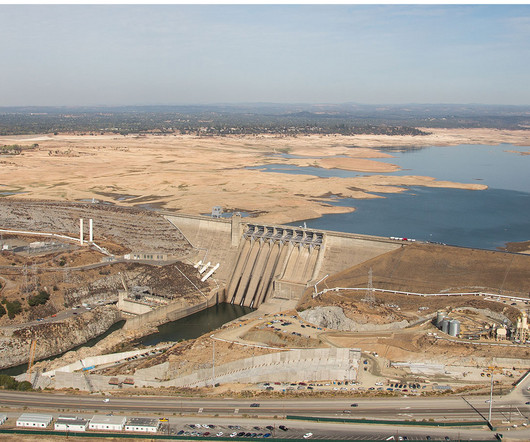
FIRO started in California and has since gone worldwide Once upon a time, there was (and still is) a megadrought in California that peaked in the acute drought of 2012 to 2016. In other words, FIRO avoids the fear of missing out (FOMO) on water that you could have stored if you had better forecasting.
I think in hindsight that my concerns from 2013 to some extent were supported by the fact that the IPCC organised an Expert Meeting on Communication, Oslo, Norway, 9–10 February 2016. The cause of our changing climate is the increase in atmospheric greenhouse gas concentrations that we have released into the air.
The difference is due largely to the differences in the regional atmospheric response that occurs in concert with the SST warming. In particular, they don’t just respond to SST changes, but also how the atmosphere changes as the SSTs change. 2016 ), a reduction of Saharan dust concentration since the 1970s ( Evan et al.
22 degrees by 2050 because of both the reduced emissions and the dissipation of methane in the atmosphere, potentially allowing the world a bit more time to reduce and sequester other greenhouse gases. A worldwide methane emission reduction of 30 percent by 2030 could reduce global warming by.22
are used all over the world, based on calculations that quantify the effects of physical mechanisms and the way different parts of the atmosphere are connected to each other. The physics-based models describe how energy flows through the atmosphere and ocean, as well as how the forces from different air masses push against each other.
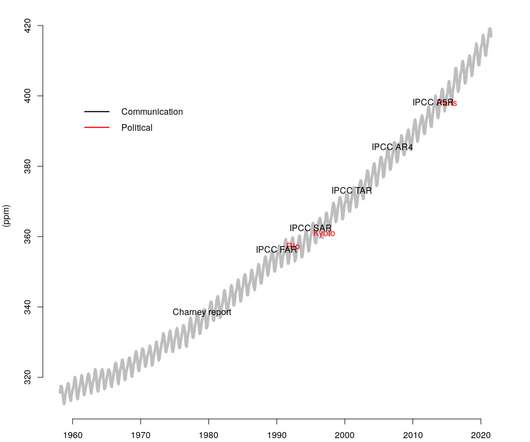
The InfluenceMap dataset includes company-by-company data on emissions of carbon dioxide–the heat-trapping gas responsible for the largest contribution to climate change–and methane, a very potent heat-trapping gas that lasts a shorter time in the atmosphere. I’ve marked these important years with dotted lines in Figure 2.
Now however, the updates to the historical warming , the use of four datasets instead of one, and of course, the series of record breaking years subsequently (2014, 2015, 2016/2020), the issue of variability in decadal trends is no longer so salient. Russell, "Climate Impact of Increasing Atmospheric Carbon Dioxide", Science , vol.
The hybrid set-up, with video links between the two hubs and digital attendence through zoom, was a change from previous ICRCs held in ICTP (2011) , Brussels (2013) , Stockholm (2016) , and Beijing (2019). 31-45, 2016. It worked impressively well, and the CORDEX ICRC 2023 streaming is available from the WCRP CORDEX YouTube channel.
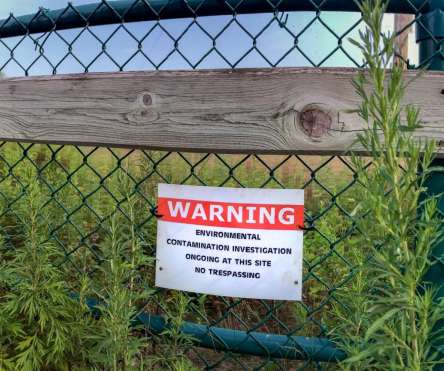
Industrial sites are likely the source of PFAS in the atmosphere. A particularly devastating bloom on the Chilean coast in 2016 killed an estimated 27 million farmed salmon and trout. For their PFAS analysis, researchers are monitoring five sites in a mix of urban and rural areas. But are they really increasing globally?
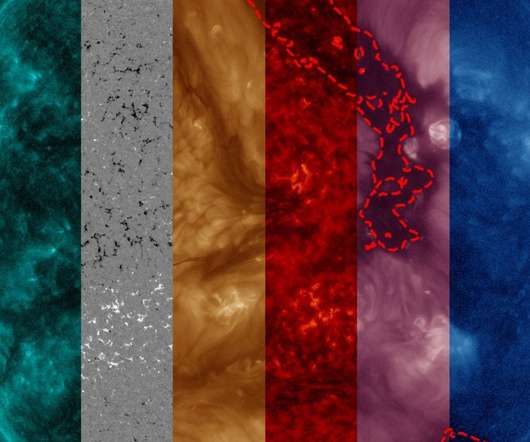
Artificial intelligence can be used to detect coronal holes in the Sun’s upper atmosphere, an international research team has shown. When observed at extreme ultraviolet (EUV) wavelengths, holes can appear in the Sun’s corona – its upper atmosphere. Coronal holes are indicated by red contour lines. Courtesy: Jarolim et al.
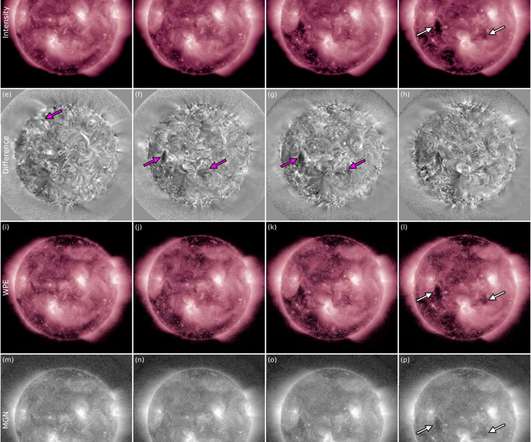
Palmerio and collaborators looked at four stealth CMEs that occurred between 2008 and 2016. The novel imaging techniques applied to remote sensing data of the coronal mass ejection on 08 Oct 2016. nm) captured by the Atmospheric Imaging Assembly instrument on board NASA’s Solar Dynamics Observatory.
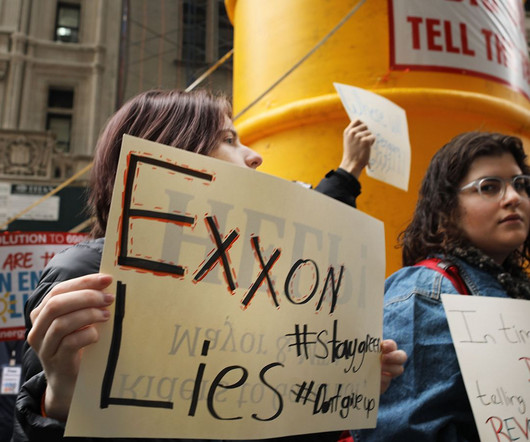
Dr. Susan Avery, a physicist and atmospheric scientist, is the former director of Woods Hole Oceanographic Institution (WHOI) in Massachusetts. It’s worth noting that the shareholder proposal requesting the nomination of a climate expert to ExxonMobil’s board received just over 20 percent support in 2016.
I hope we can collectively reckon with another terrifyingly awesome atmospheric event: the hottest year. C hotter than the second-hottest year to date, 2016. Multiple relentless heat waves occurred in 2023 , with much of the globe experiencing 20 more “heatwave days” than in the previous three decades.
He joined the company in 2016, bringing his passion and experience gained in several sales and marketing-related roles across photonics research and industry. With a background in laser-induced fluorescence spectroscopy for atmospheric research, he carried out his PhD thesis at the Max Planck Institute for Chemistry in Mainz, Germany.
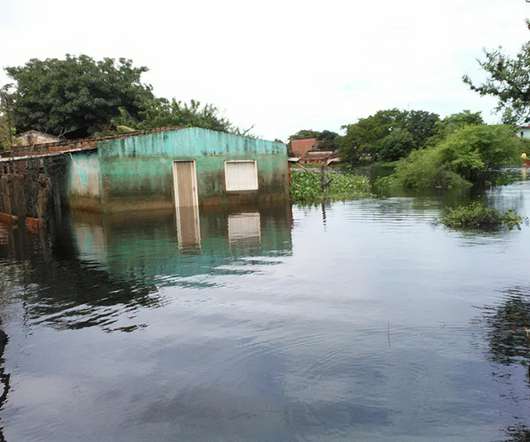
million jobs in 2022, according to a report last year by the National Oceanic and Atmospheric Administration. A 2020 study in the Proceedings of the National Academy of Sciences found that wetland losses in Florida between 1996 and 2016 resulted in an additional $430 million in property damage from Hurricane Irma in 2017.
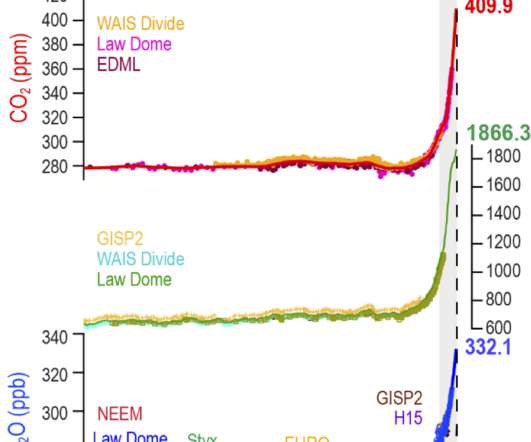
degrees Celsius warmer than in the 1850-1900 pre-industrial period, when humans began burning fossil fuels on an industrial scale, pumping carbon dioxide into the atmosphere. The Copernicus Climate Change Service added, that in 2023 the concentration of CO2 in the atmosphere rose to the highest level ever recorded at 419 PPM.
On the back of the dark and sombre Intergovernmental Panel on Climate Change (IPCC) cli mate report released last week, the US government agency National Oceanic and Atmospheric Administration (NOAA) has confirmed that this July was the warmest month ever experienced on Earth. of a degree C higher than the 2016 record.
They found that the past seven years were the world’s warmest by a clear margin, with 2016 and 2020 the warmest on record. Atmospheric CO2 levels at record highs. Levels of CO2 in the atmosphere reached 414.3 C above 1850-1900 levels. parts per million in 2021, up by around 2.4 ppm from 2020, the scientists said.
National Oceanic and Atmospheric Administration, highlighted new threats facing the Arctic: marine trash and noise pollution. Traffic from fishing, cargo, and military ships has increased by 58% between 2016 and 2019. This article was originally published by Bridge Michigan as part of the Great Lakes News Collaborative.
The 24-month study process begins with the Colorado Basin River Forecast Center, a team of scientists operating within the National Oceanic and Atmospheric Administration. Cody Moser, a senior hydrologist at the Center, told Circle of Blue that data from the years 2016 through 2020 will be added this fall. Click To Tweet.
Both von Klitzing and Thouless won the Nobel Prize for Physics for their contributions, in 1985 and 2016 , respectively. David Thouless, Duncan Haldane and Michael Kosterlitz win 2016 Nobel Prize for Physics. First of all, the slim layers of the Earth’s atmosphere and oceans can be approximated as 2D.
A negative CI score would suggest an almost magical climate solution that pulls several carbon dioxide molecules from the atmosphere for each one that comes from the tailpipe of a truck running on dairy biomethane. i] For more on the carbon intensity of transportation fuels, see my 2016 report, Fueling a Clean Transportation Future.
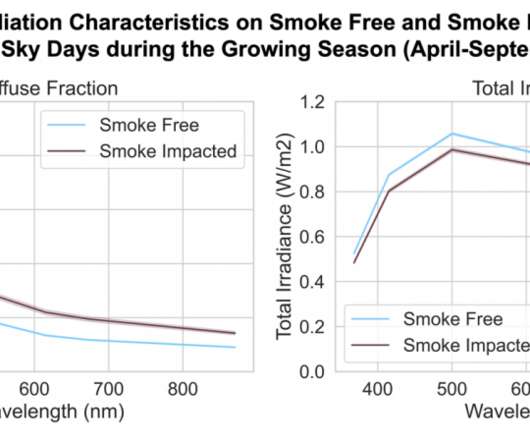
Candidate in the Department of Atmospheric Science and Trainee in the CSU InTERFEWS Program Figure 1: Cover art for The War of the Worlds novel by H.G. Large ash particles that rain down and blanket nearby communities are only a fraction of what wildfires billow into the atmosphere. in the atmosphere over the western U.S.
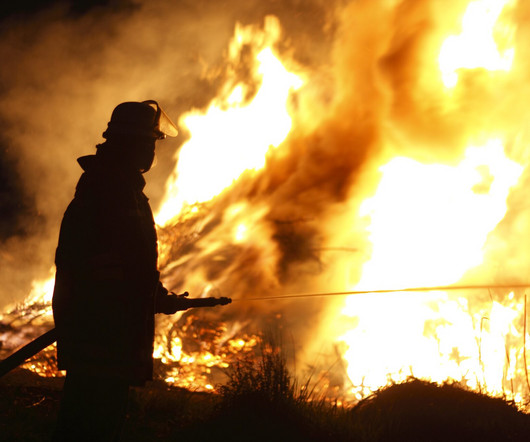
Smoke from wildfires near Fort McMurray in 2016. In what must be a deeply troubling sense of deja vu, the entire 66,000-person population of Fort McMurray has been told to be prepared to leave on short notice as a 7,700-ha fire burns to the city’s southwest. It simply perpetuates the crisis.
According to the respected International Energy Agency’s new report, global greenhouse gases emissions from energy remained flat in 2016 while the global economy grew by 3.1 Coal demand fell worldwide but the drop was particularly sharp in the United States, where demand was down 11% in 2016. Deforestation is one.
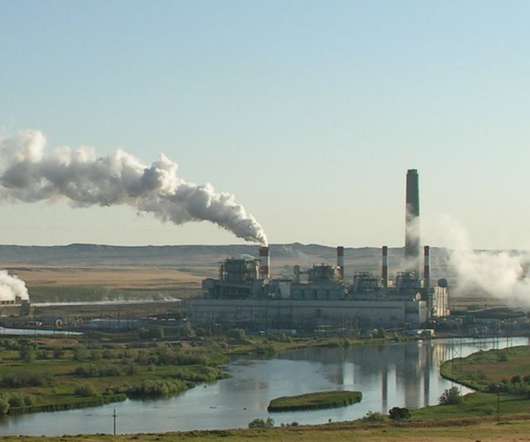
Detlev Helmig: Colorado atmospheric scientist and air pollution expert – Speaking on data his team is presently collecting at an oil refinery in Denver, Colorado which involves the first ever continual real-time monitoring of oil and gas industry radioactive emissions.
There are even suggestions that condensation trails left by aircraft have boosted night-time temperatures by reducing how much heat can escape the surface layers of the atmosphere to space, although the evidence is somewhat mixed. C, in July 2016. C, also set in July 2016. This is known as the urban heat island effect.
Plugging wells to stop the vertical flow of fluids and gas is critical to preventing ground and surface water contamination and the release of climate-changing methane gas into the atmosphere. Read more here.]
It may migrate along cracks, faults and fissures before finding its way back to the atmosphere. In 2016 the Massachusetts Institute of Technology closed its Carbon Capture and Sequestration Technologies program because the 43 projects it was involved with had all been canceled, put on hold or converted to other things.”
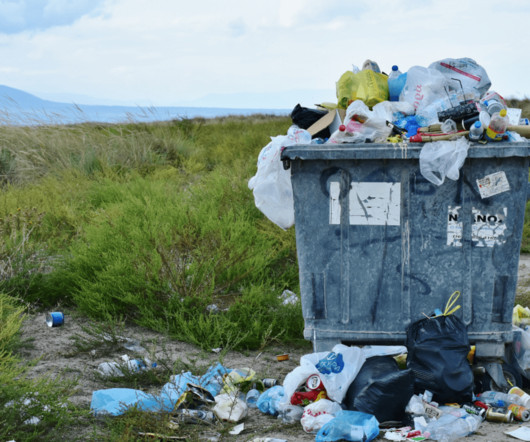
Burning waste—especially plastic waste—generates toxic and climate-warming gases that fill our air, our lungs and our atmosphere, warming the climate and making people sick. Pollution data released from Canada’s newest waste incinerator, located east of Toronto, showed releases of dioxins and furans 12 times greater than permitted in 2016.
Therefore, it is hardly surprising that National Oceanic and Atmospheric Administration (NOAA) earlier this month confirmed that July was the warmest month ever measured since records began. It beat a five-year-long record that had stood been measured since 2016.
Lance/2016/Flickr , CC BY-NC-ND 2.0. Thanks to a combination of atmospheric science studies based on sophisticated climate modelling and geoscience studies based on paleoclimate data derived from fossil coral records , researchers generally agree that human-caused climate change will soon increase El Niño frequency and intensity.
A top-down approach begins with atmospheric emissions as recorded by sensors or satellites which can then, by a variety of methods, be attributed to geographic regions or particular categories of emitters. A rice emissions estimate could consider factors like the area used for rice production and water management method, among many others.
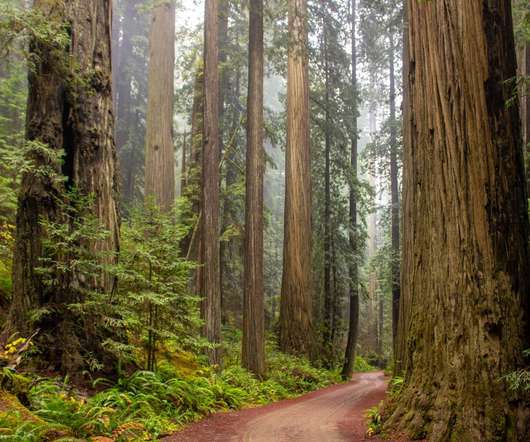
Environmental and atmospheric conditions are perfectly balanced in these locations, leaving trees with only one thing left to compete for – light. However, more greenhouse gases escaping into the atmosphere could enable Redwoods to grow quicker. Increasing its concentration in the atmosphere could result in better growth.
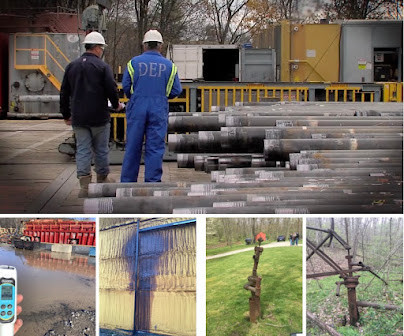
DEP’s Oil & Gas Compliance database shows DEP inspections found hundreds of violations at Rice Drilling B LLC unconventional and conventional oil and gas sites between January 1, 2019 and October 1, 2022 including multiple violations like-- -- Abandoning wells without plugging them -- Discharge of drilling wastewater into the ground -- Failure (..)
At the Delhagen Well Pad and wells 2H and 5H in Rush Township, Susquehanna County DEP found continuing violations related to defective well casing and cementing that first began on June 16, 2016. Sign up for DEP’s eNOTICE service which sends you information on oil and gas and other permits submitted to DEP for review in your community.
We organize all of the trending information in your field so you don't have to. Join 12,000+ users and stay up to date on the latest articles your peers are reading.
You know about us, now we want to get to know you!
Let's personalize your content
Let's get even more personalized
We recognize your account from another site in our network, please click 'Send Email' below to continue with verifying your account and setting a password.


Let's personalize your content