This site uses cookies to improve your experience. To help us insure we adhere to various privacy regulations, please select your country/region of residence. If you do not select a country, we will assume you are from the United States. Select your Cookie Settings or view our Privacy Policy and Terms of Use.
Cookie Settings
Cookies and similar technologies are used on this website for proper function of the website, for tracking performance analytics and for marketing purposes. We and some of our third-party providers may use cookie data for various purposes. Please review the cookie settings below and choose your preference.
Used for the proper function of the website
Used for monitoring website traffic and interactions
Cookie Settings
Cookies and similar technologies are used on this website for proper function of the website, for tracking performance analytics and for marketing purposes. We and some of our third-party providers may use cookie data for various purposes. Please review the cookie settings below and choose your preference.
Strictly Necessary: Used for the proper function of the website
Performance/Analytics: Used for monitoring website traffic and interactions
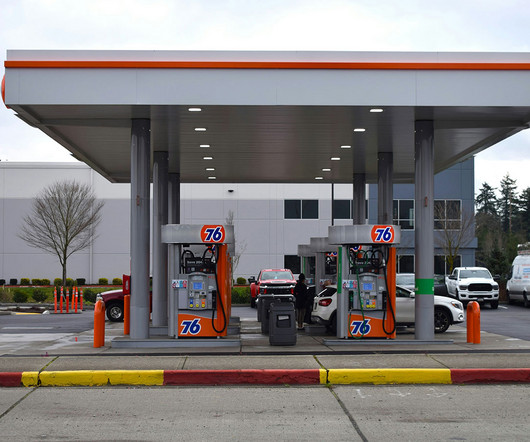
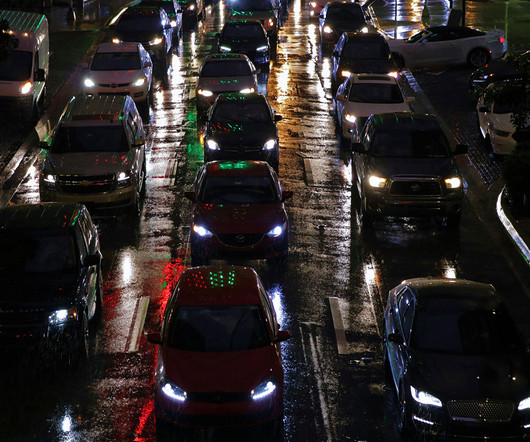
Despite adding six million more passenger cars, trucks, and SUVs to the roads over the last 10 years, California’s gasoline consumption has dropped over two billion gallons from its peak in 2005. Gasoline use per person has also fallen, from 445 gallons per year per person in 2005, to under 350 gallons per year per person in 2024.
The Environmental Protection Agency’s (EPA) Clean School Bus (CSB) Program was established by the Energy Policy Act of 2005 to help communities reduce pollution from older, higher polluting school buses. Despite past investments, thousands of older polluting school buses remain on the road. But lower climate emissions aren’t the only benefit.
Under the 2015 Paris Agreement, the United States voluntarily pledged to reduce its global warming emissions at least 50 percent below their 2005 levels by the end of this decade and reach net-zero emissions no later than 2050.
We’ve made progress The Inflation Reduction Act (IRA) and the Investment and Jobs Act (IIJA) contribute significantly towards the US’s 2030 climate targets (50-52% reduction of global warming emissions below 2005 levels) and exceed these targets by 2035. Since vehicles are the largest sources of PM2.5
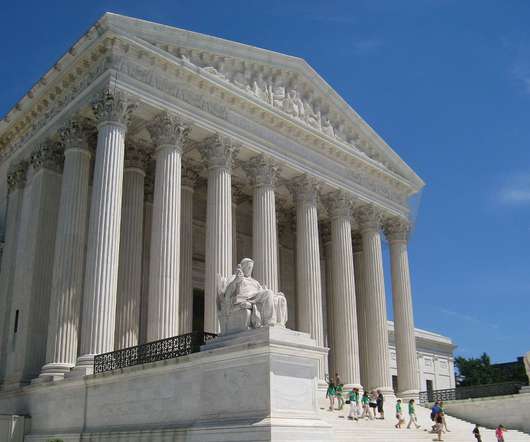
Had the court ruled fully in favor of the EPA— or not taken the case at all —a much more meaningful dent in power plant carbon emissions would be within reach, while also delivering much greater reductions in other dangerous co-pollutants from burning fossil fuels such as particulate matter, mercury, nitrogenoxides and sulfur dioxide.
Examples are benzene, hydrofluoric acid, particulate matter, sulfur dioxide, nitrogenoxides, and many, many other toxic pollutants. March 2005 – Explosions at BP America refinery in Texas City, considered one of the worst industrial accidents to date, was caused by over-pressurization in a distillation tower.
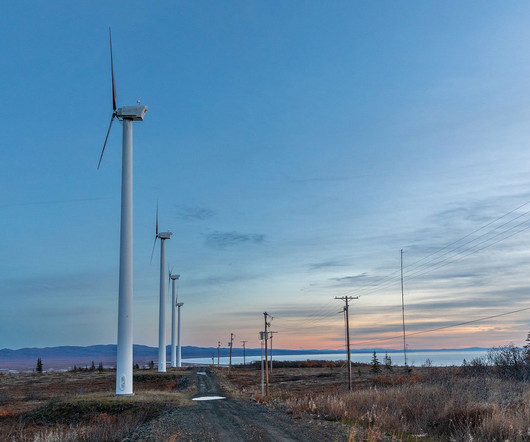
New UCS study shows how we can accelerate US clean energy ambition An interdisciplinary team of UCS experts set out to explore how the US can meet its goals to cut heat-trapping emissions 50%-52% below 2005 levels by 2030 and achieve net zero emissions no later than 2050. The reductions in PM2.5
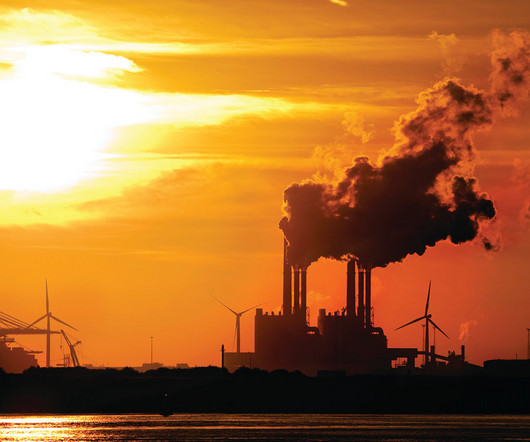
Nitrogenoxides, which can cause damage to the respiratory pathways as well as the burning of eyes and skin, are byproducts of high temperature combustion. Flaring, which is shown here, as well as venting, can be a significant source of both nitrogenoxides and greenhouse gas emissions such as methane.
Since 2005, shale gas development, also known as unconventional natural gas development (UNGD), has grown rapidly. Air Pollution Air pollutants such as carbon monoxide (CO), hydrogen sulfide (H2S), nitrogenoxides (NOx), particulate matter (PM), and volatile organic compounds (VOCs) are released from various stages of shale gas development.
Environmental Protection Agency methodologies to assign a dollar value to each ton of nitrogenoxide and sulfur dioxide reduced. Between 2005-2022, the last year of available data, 11,127,515 fewer tons of SOx and 1,317,335 fewer tons of NOx were emitted from Pennsylvania’s electric power sector, according to DEP data.
Martin Produces Whale Of A Guitar For Earth Day As Lehigh Valley Company Continues Environmental Tradition -- The Center Square - Anthony Hennen: PJM Electric Grid Has Significant Decline In Carbon Dioxide, NitrogenOxide, Sulfur Dioxide Emissions Since 2005 -- Scranton Times: Author Diane Ackerman Sheds Light On Environmental Factors And Mental Health (..)
Last month, the Environmental Protection Agency (EPA) proposed new power plant carbon pollution standards that, if strengthened, would go a long way to help meet the Biden administration’s goal of slashing carbon emissions in half from 2005 levels by the end of this decade. billion to $5.9 billion.
.' -- The Allegheny Front: US Energy Secretary Visits Pittsburgh Steel Plant To Tout New Energy Efficiency Rule, Union Jobs -- Post-Gazette Editorial: Saving Butler Steel Mill From New Federal Rules Was Inspired Policymaking -- The Center Square - Anthony Hennen: PJM Electric Grid Has Significant Decline In Carbon Dioxide, NitrogenOxide, Sulfur Dioxide (..)
We organize all of the trending information in your field so you don't have to. Join 12,000+ users and stay up to date on the latest articles your peers are reading.
You know about us, now we want to get to know you!
Let's personalize your content
Let's get even more personalized
We recognize your account from another site in our network, please click 'Send Email' below to continue with verifying your account and setting a password.


Let's personalize your content